


Acumatica Analytics for Mid-Sized Businesses
DataSelf Ultralight Data Warehouse and the DataSelf ETL are both the best on the market for mid-sized organizations. But if we can’t beat the leaders, we join them! Today DataSelf solutions include its own best of breed components complemented by Gartner-recognized platforms such as Microsoft SQL Server and the renowned Tableau visualization engine.
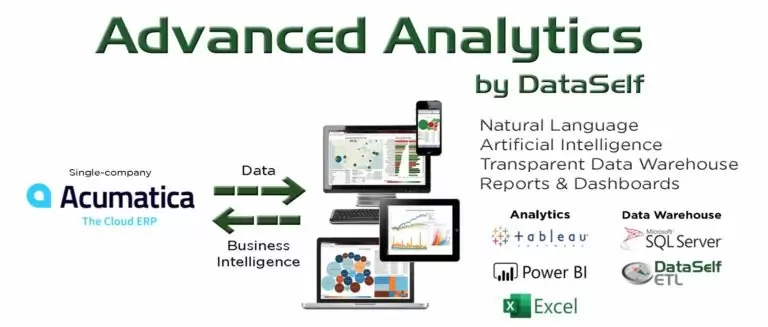
Advanced Analytics
Enterprise Analytics
- Deploys in hours
- Easy access to Sage 100 data anytime and anywhere
- Natural language & AI: create new reports in plain English
- Transparent data warehousing & Tableau
- Includes all features from Advanced Analytics
- Full-fledged data warehouse for complex and large data volume needs
- Extensive library of pre-configured KPIs
- Can integrate data from data silos
Key Features
- Natural language queries
- Secure access over the internet
- Extensive slice-and-dice, filtering and drill down features.
- Geographical trend analysis through maps.
- Automatically distributing reports and dashboards to licensed users by email on schedule.
- Export reports via PDF, Excel, PNG, and Power Point.
- Create, modify and publish custom reports, dashboards, and projects (folders).
- Access and download underlying data.
- Comment feature for team collaboration.
- Control user access to reports, dashboards and data sources.
- Independent user credentials. Add-ons: MFA and SSO.
- One-click open of Acumatica pages directly from reports and dashboards.
- Embed Advanced Analytics reports in Acumatica. Details here.
- Embed Advanced Analytics pages into other applications via Java code and iFrame.
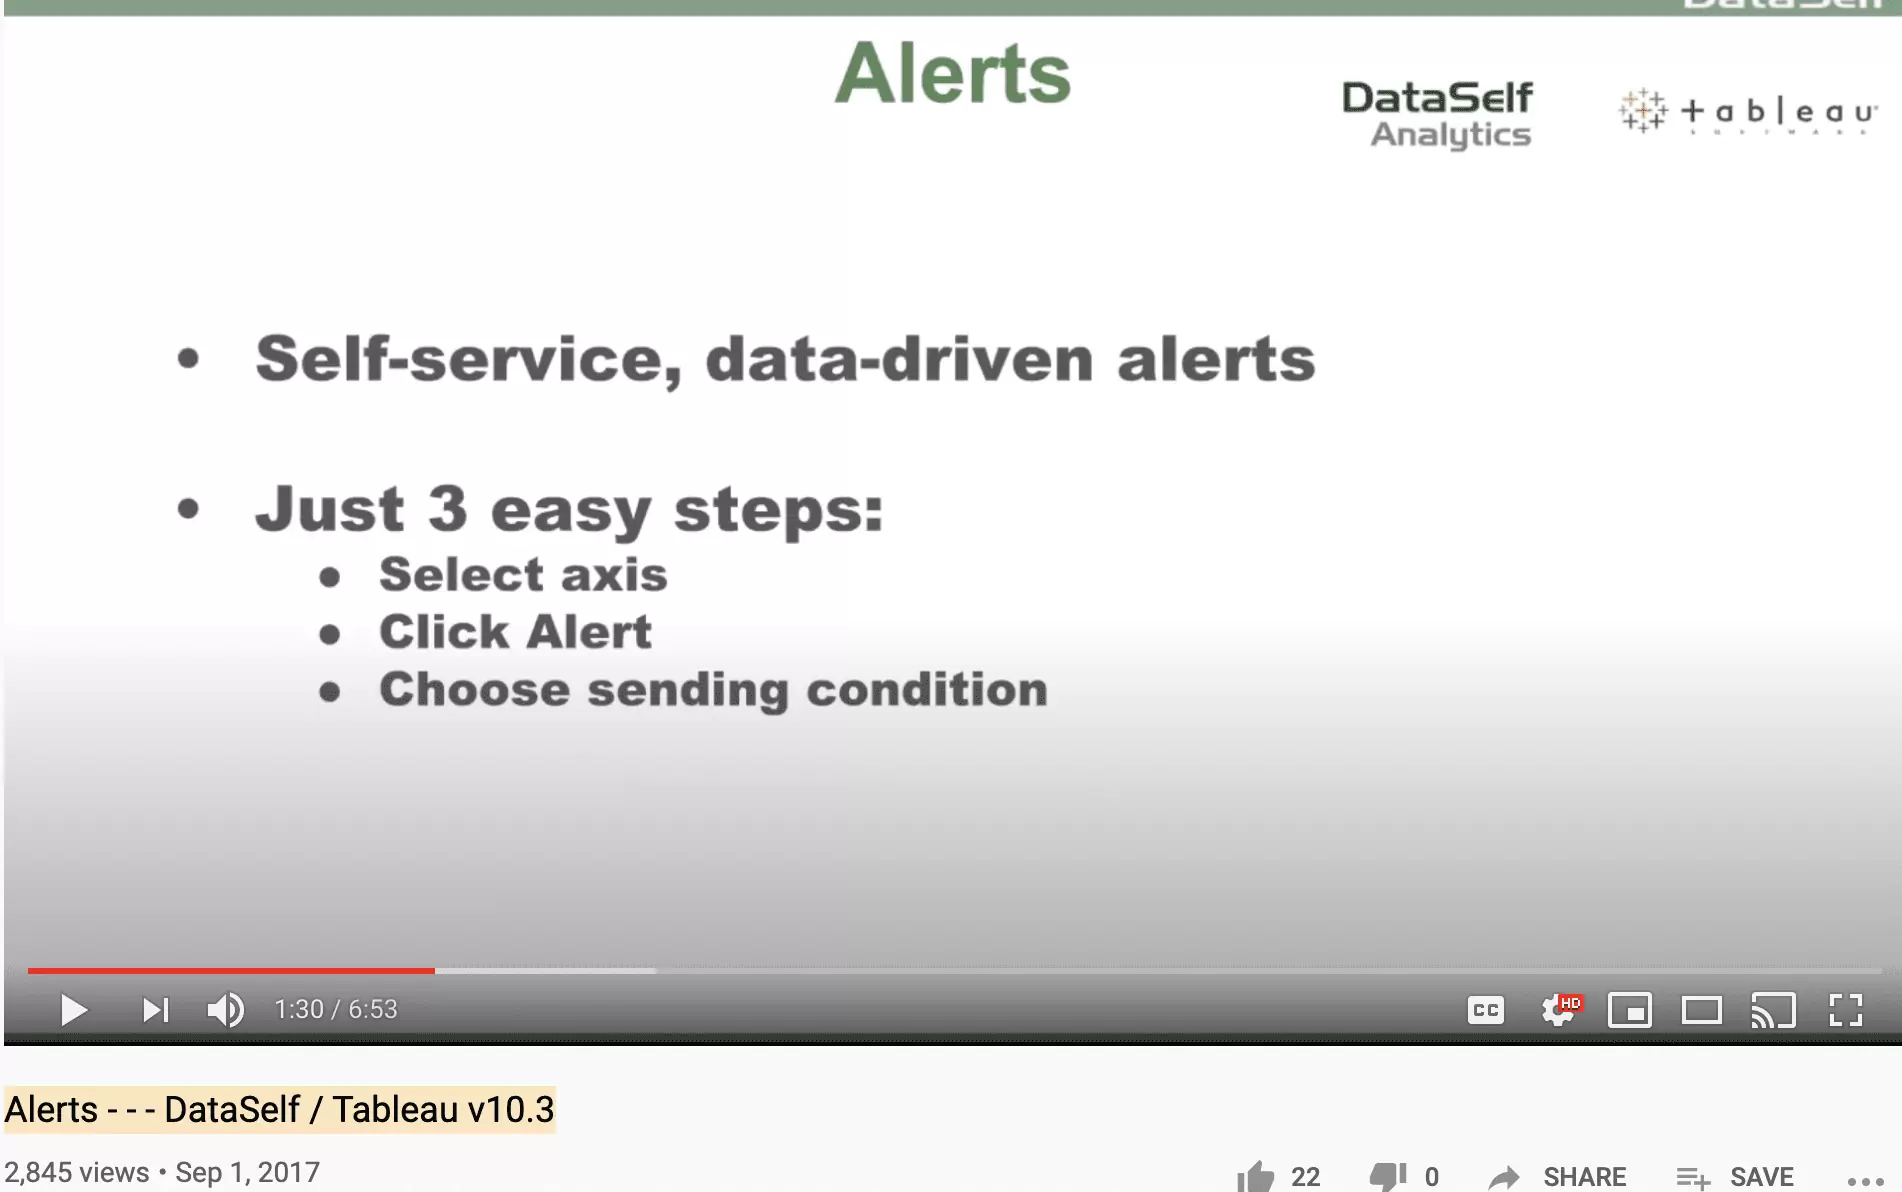
- Data alerts (notify by email when a threshold has been crossed).
Transparent Cloud Data Warehouse
- Requires one Acumatica user for data extraction.
- Acumatica-certified data extraction process that causes little impact in Acumatica databases (extract burst cycles: 2 sec pull, 2 secs pausing, repeat)
- After the initial data extract, subsequent overnight refreshes only extract new and updated records
- User-controlled data warehouse remapping
- Changing auto refresh schedule
- On-demand data refresh.
Limitation: Data warehouse functions such as additional data sources, data consolidation, cleaning, and preparation are not included. See Enterprise Analytics by DataSelf for advanced data warehousing capabilities
System Architecture
Advanced Analytics by DataSelf leverages transparent data warehousing, optimized Acumatica-certified ETL (extraction, transformation and loading) processes, AWS (Amazon Web Services), Tableau (and Power BI soon), and a rich set of templates to Acumatica to deliver natural language query, artificial intelligence, machine learning, and insightful and interactive reports and dashboards!
It’s easy to customize the solution to your specific custom needs. Customizable Generic Inquiries (GIs) control what data is extracted from Acumatica. And Tableau provides a robust, secured, easy-to-use, and well documented analytics interface. At the end of the day, users can easily customize the data extraction, create and modify their reports and dashboards, and control user security access.
Dashboards
Core Financials Edition
360-View Dashboard for Acumatica provides management with a single place to monitor the organization’s main key performance indicators, and easily slice and dice trends to uncover threats and opportunities
Distribution
DataSelf BI solution comes with 5,000-plus must-have reports and KPIs predefined
Manufacturing
DataSelf BI solution comes with 5,000-plus must-have reports and KPIs predefined
Analytics By Industry
Distribution
DataSelf BI solution comes with 5,000-plus must-have reports and KPIs predefined
Warehouse
Too many companies have lopsided inventory: too much of some items and too little of others. Or they make too many inventory transfers and spend too much dealing with them. Analyzing historical trends in detail can be a critical step toward big savings.
With inventory projection, you learn from your history and use the lessons to fine tune inventory for the future. Inventory projection can provide numbers based on several parameters, such as product, location, and any time granularity down to the day level.
Inventory replenishment builds on inventory projection. It will not only forecast your inventory needs but also indicate from whom you should buy and when. Inventory replenishment can provide numbers based on several parameters, such as product, location, and any time granularity down to the day level.
Office
Tough times? Focus on smarter sales! See at a glance who’s buying what, where you’re making the most profit, which products or customers are declining or growing the most, which customers are no longer buying, and lots of other insights. The solution is so easy to use that sales people can slice and dice sales data on the fly. Our 500-plus report and KPI templates for sales analysis make it a cinch to form a tight fit, no matter how unusual your operations. It’s a managers’ dream.
To buy smart, you have to know your purchasing trends. But too often, sales-driven companies don’t track them. This module makes it easy.
Enterprise
Do you need to integrate data from several data sources for analysis? DataSelf BI can do it for you. You may have a multi-company environment or other business applications. DataSelf BI will provide you with a user-friendly and single place for all your reporting needs.
Feeling lonely? No wonder. Mid-size applications usually provide only limited support for multi-currency frameworks. DataSelf BI can significantly improve the reporting of your multi-currency environment.
This is all a great start! However, all modules can be adapted to your specific needs. On average, 70% to 100% of non-technical users can adapt report templates and KPIs without technical help—faster than it takes to eat a donut.
Manufacturing
DataSelf BI solution comes with 5,000-plus must-have reports and KPIs predefined
Manufacturing
Too many companies have lopsided inventory: too much of some items and too little of others. Or they make too many inventory transfers and spend too much dealing with them. Analyzing historical trends in detail can be a critical step toward big savings.
With inventory projection, you learn from your history and use the lessons to fine tune inventory for the future. Inventory projection can provide numbers based on several parameters, such as product, location, and any time granularity down to the day level.
Easily analyze your BOMs and work orders to find the most productive way to fulfill your orders.
Office
Tough times? Focus on smarter sales! See at a glance who’s buying what, where you’re making the most profit, which products or customers are declining or growing the most, which customers are no longer buying, and lots of other insights. The solution is so easy to use that sales people can slice and dice sales data on the fly. Our 500-plus report and KPI templates for sales analysis make it a cinch to form a tight fit, no matter how unusual your operations. It’s a managers’ dream.
To buy smart, you have to know your purchasing trends. But too often, sales-driven companies don’t track them. This module makes it easy.
Enterprise
Do you need to integrate data from several data sources for analysis? DataSelf BI can do it for you. You may have a multi-company environment or other business applications. DataSelf BI will provide you with a user-friendly and single place for all your reporting needs.
Feeling lonely? No wonder. Mid-size applications usually provide only limited support for multi-currency frameworks. DataSelf BI can significantly improve the reporting of your multi-currency environment.
This is all a great start! However, all modules can be adapted to your specific needs. On average, 70% to 100% of non-technical users can adapt report templates and KPIs without technical help—faster than it takes to eat a donut.
DataSelf + Acumatica
DataSelf shows a 360-degree view of their business
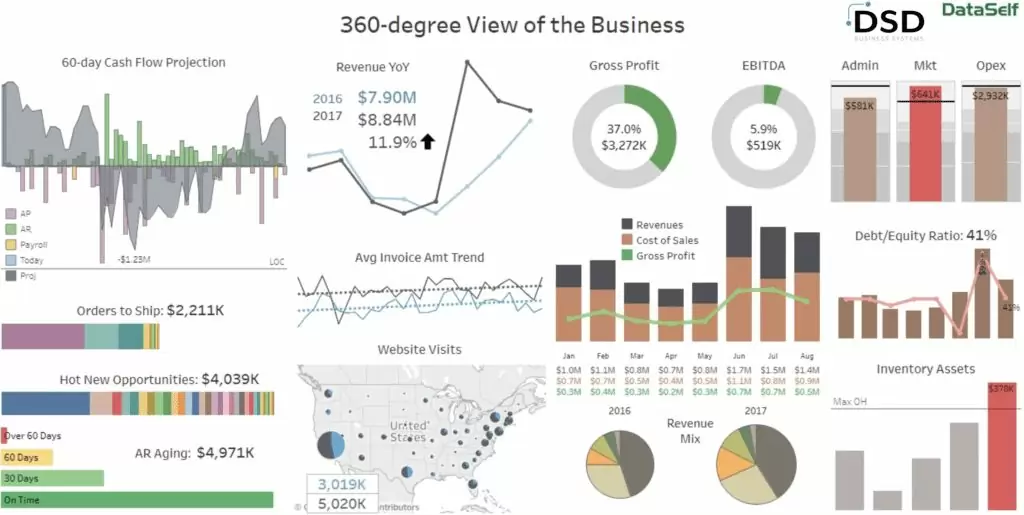
Immediately the CEO can view:
- Cash flow projection
- Orders to ship
- Revenue
- Several other key metrics
DataSelf dashboards reveal a wide overview of all the important areas of business.
Highlighted Insights and Possible Issues
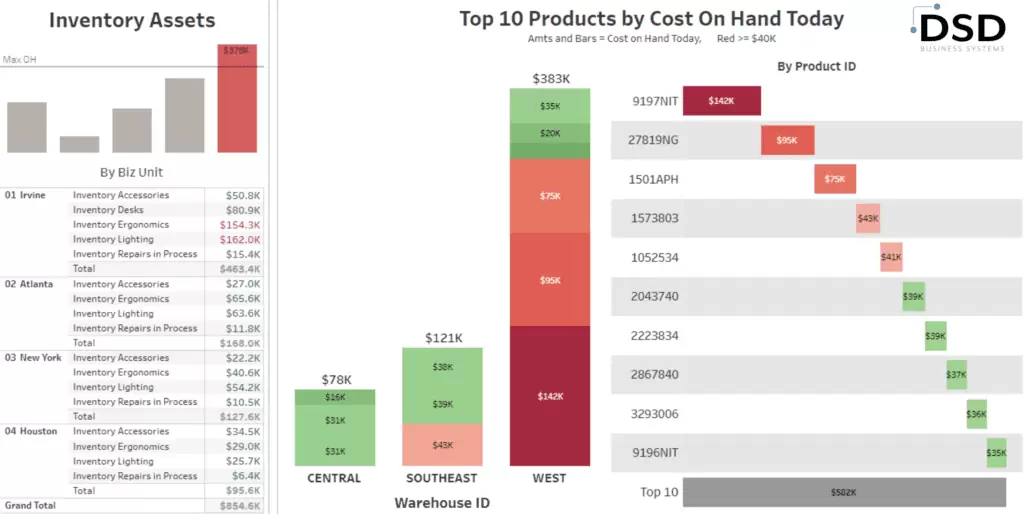
At a glance, the dashboard will show you where the issues are and red flags draw attention to areas that need attention. For example, this red bar below quickly communicates that inventory levels are too high.
Primary Benefits
Mature BI system with over 5,000 report and dashboard templates
While each business is unique, there are lots of common reporting needs that are critical across many organizations. You’ll likely find perfect answers among our 400+ reports and dashboards for customer sales, or answers will only require simple template adjustments. DataSelf templates seamlessly connect Acumatica and other ERP and CRM systems.
flexible framework to consolidate all of your data silos
Data warehousing effectively automates repetitive manual processes, optimizes data for fast performance, and brings all of your data together for a single version of the truth. DataSelf has been refining and leveraging the latest data warehousing technology for over a decade so your team can focus on data analysis instead of data preparation.
Deploys in a few of hours
We just need your Acumatica URL and user credentials. We’ll upload DataSelf GIs to your site and run a data refresh. You’ll be able to access your DataSelf reports and dashboards in just a few hours
Demo Videos
Customer Testimonials
